
Description
Resource Description
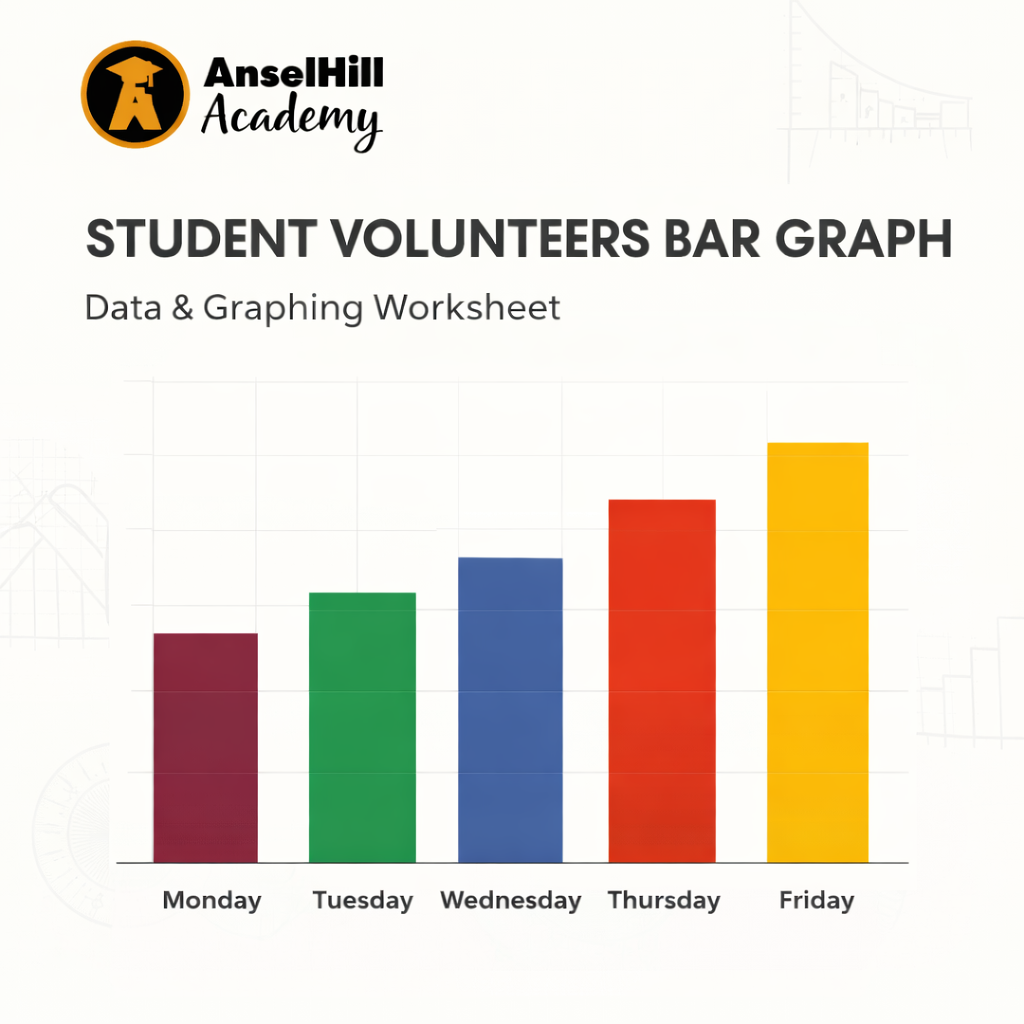
The Student Volunteers Bar Graph – Data & Graphing Worksheet is a practical, curriculum-aligned maths resource that helps students develop confidence in data handling and graph interpretation.
Using a real-life scenario of daily student volunteers across a school week, learners are guided to construct a bar chart using correct titles, axis labels, and a suitable scale. This resource supports visual learning, accuracy, and mathematical reasoning.
The pack includes:
-
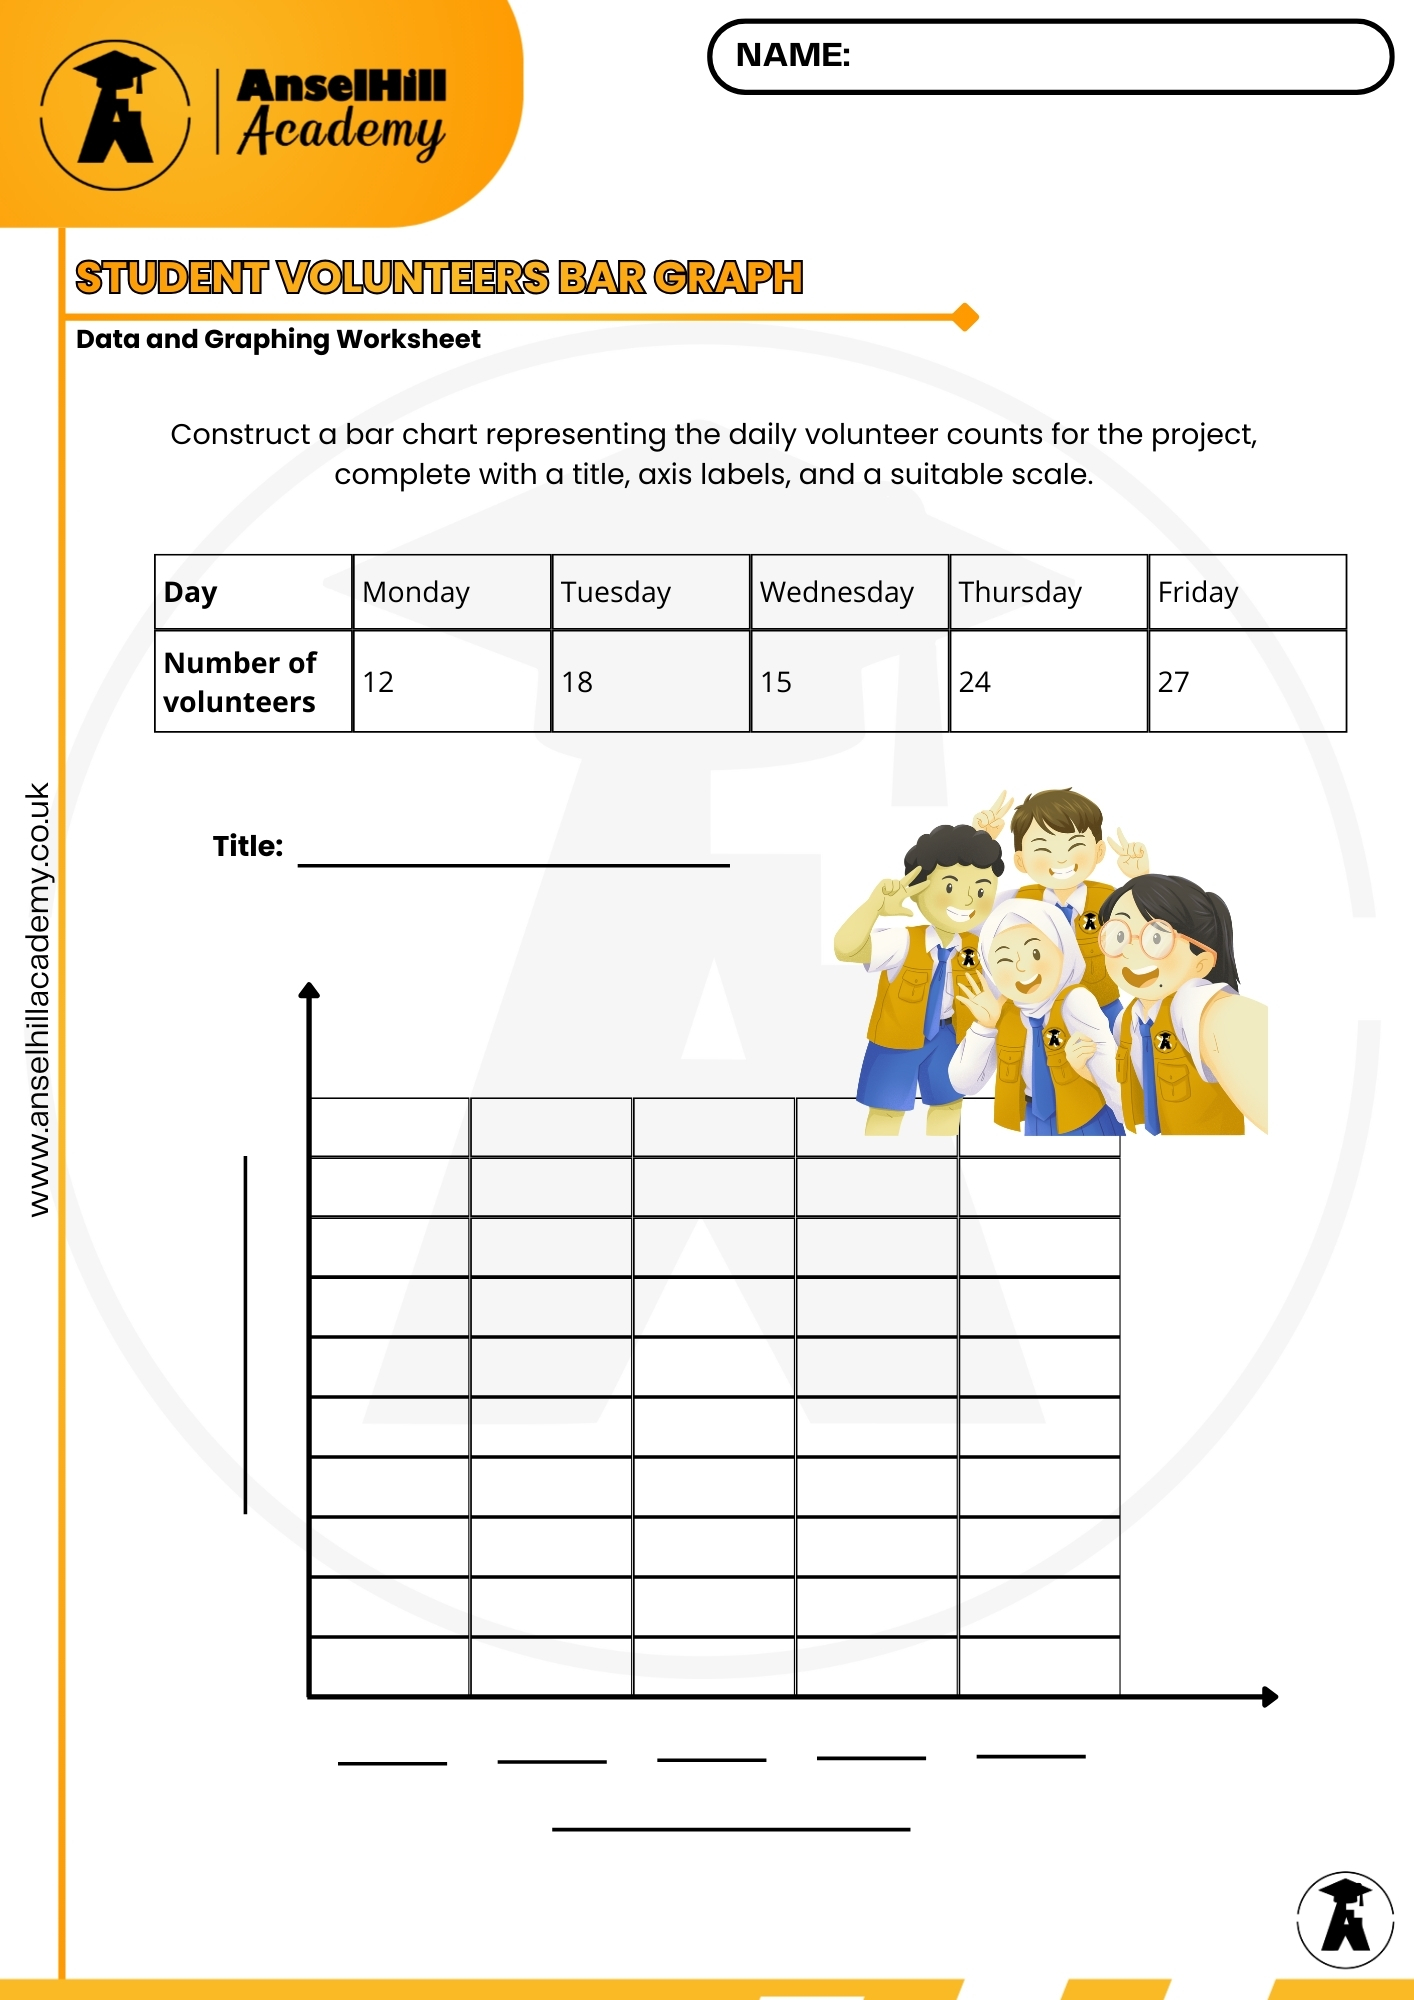
A student worksheet with clear instructions and a blank graph grid
-
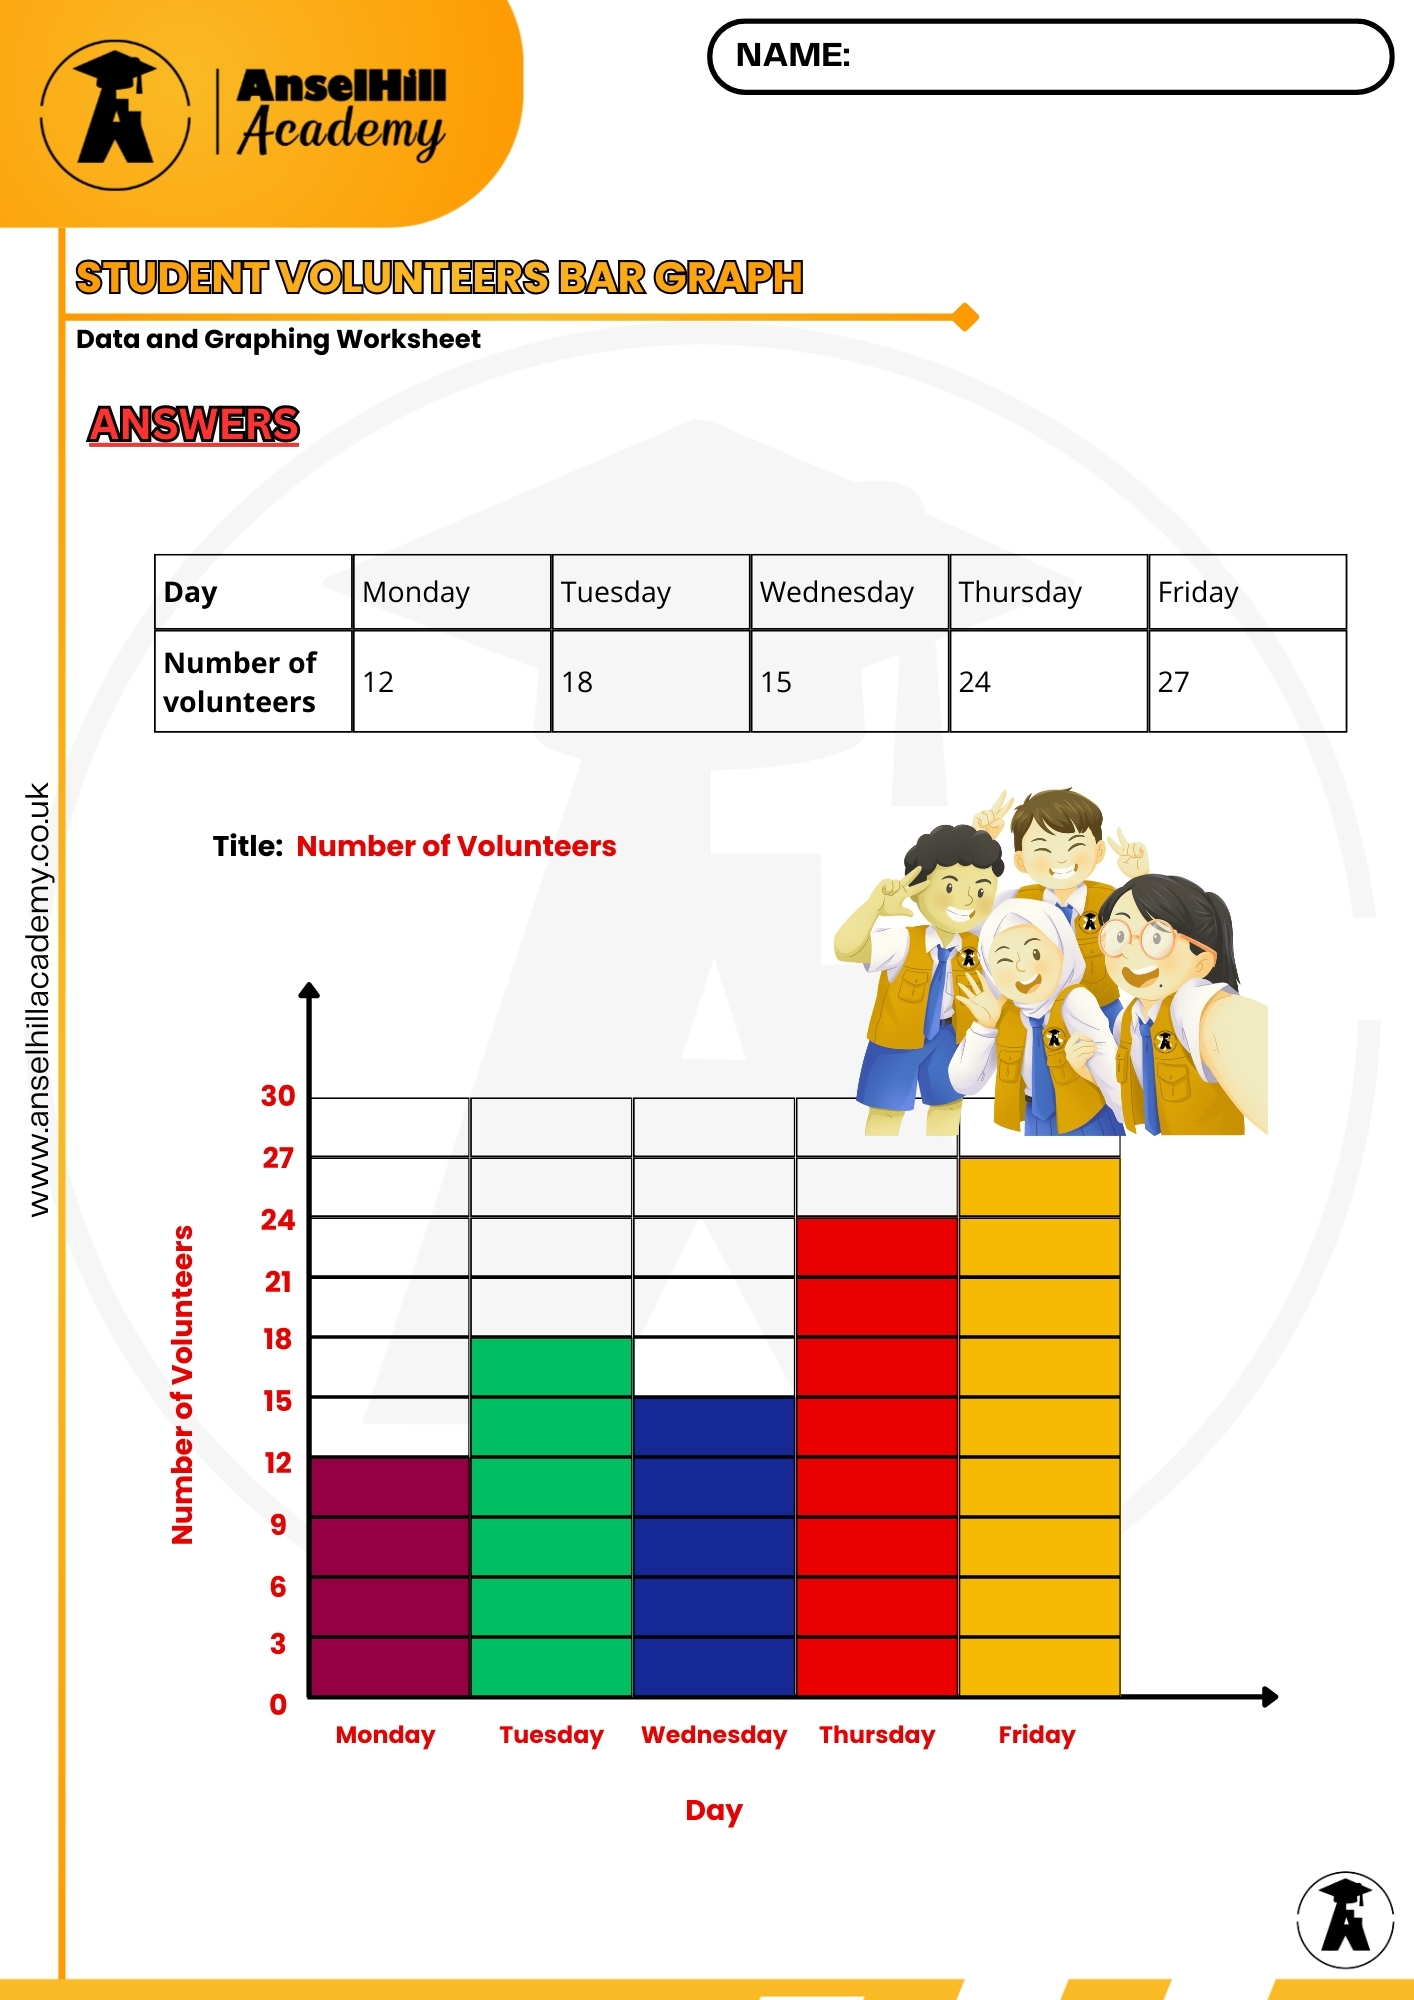
A completed answer sheet showing the correct bar graph for teacher reference or student self-checking
This resource is ideal for classroom use, homework, revision sessions, or independent practice.
📘 Learning Objectives
By completing this worksheet, students will be able to:
-
Read and interpret data presented in a table
-
Construct a bar graph accurately
-
Label axes correctly and choose an appropriate scale
-
Understand how data can be represented visually
🧠 Skills Developed
-
Data handling
-
Graph drawing
-
Mathematical accuracy
-
Visual interpretation
-
Exam-style presentation skills


Reviews
There are no reviews yet.