


Description
Resource Description
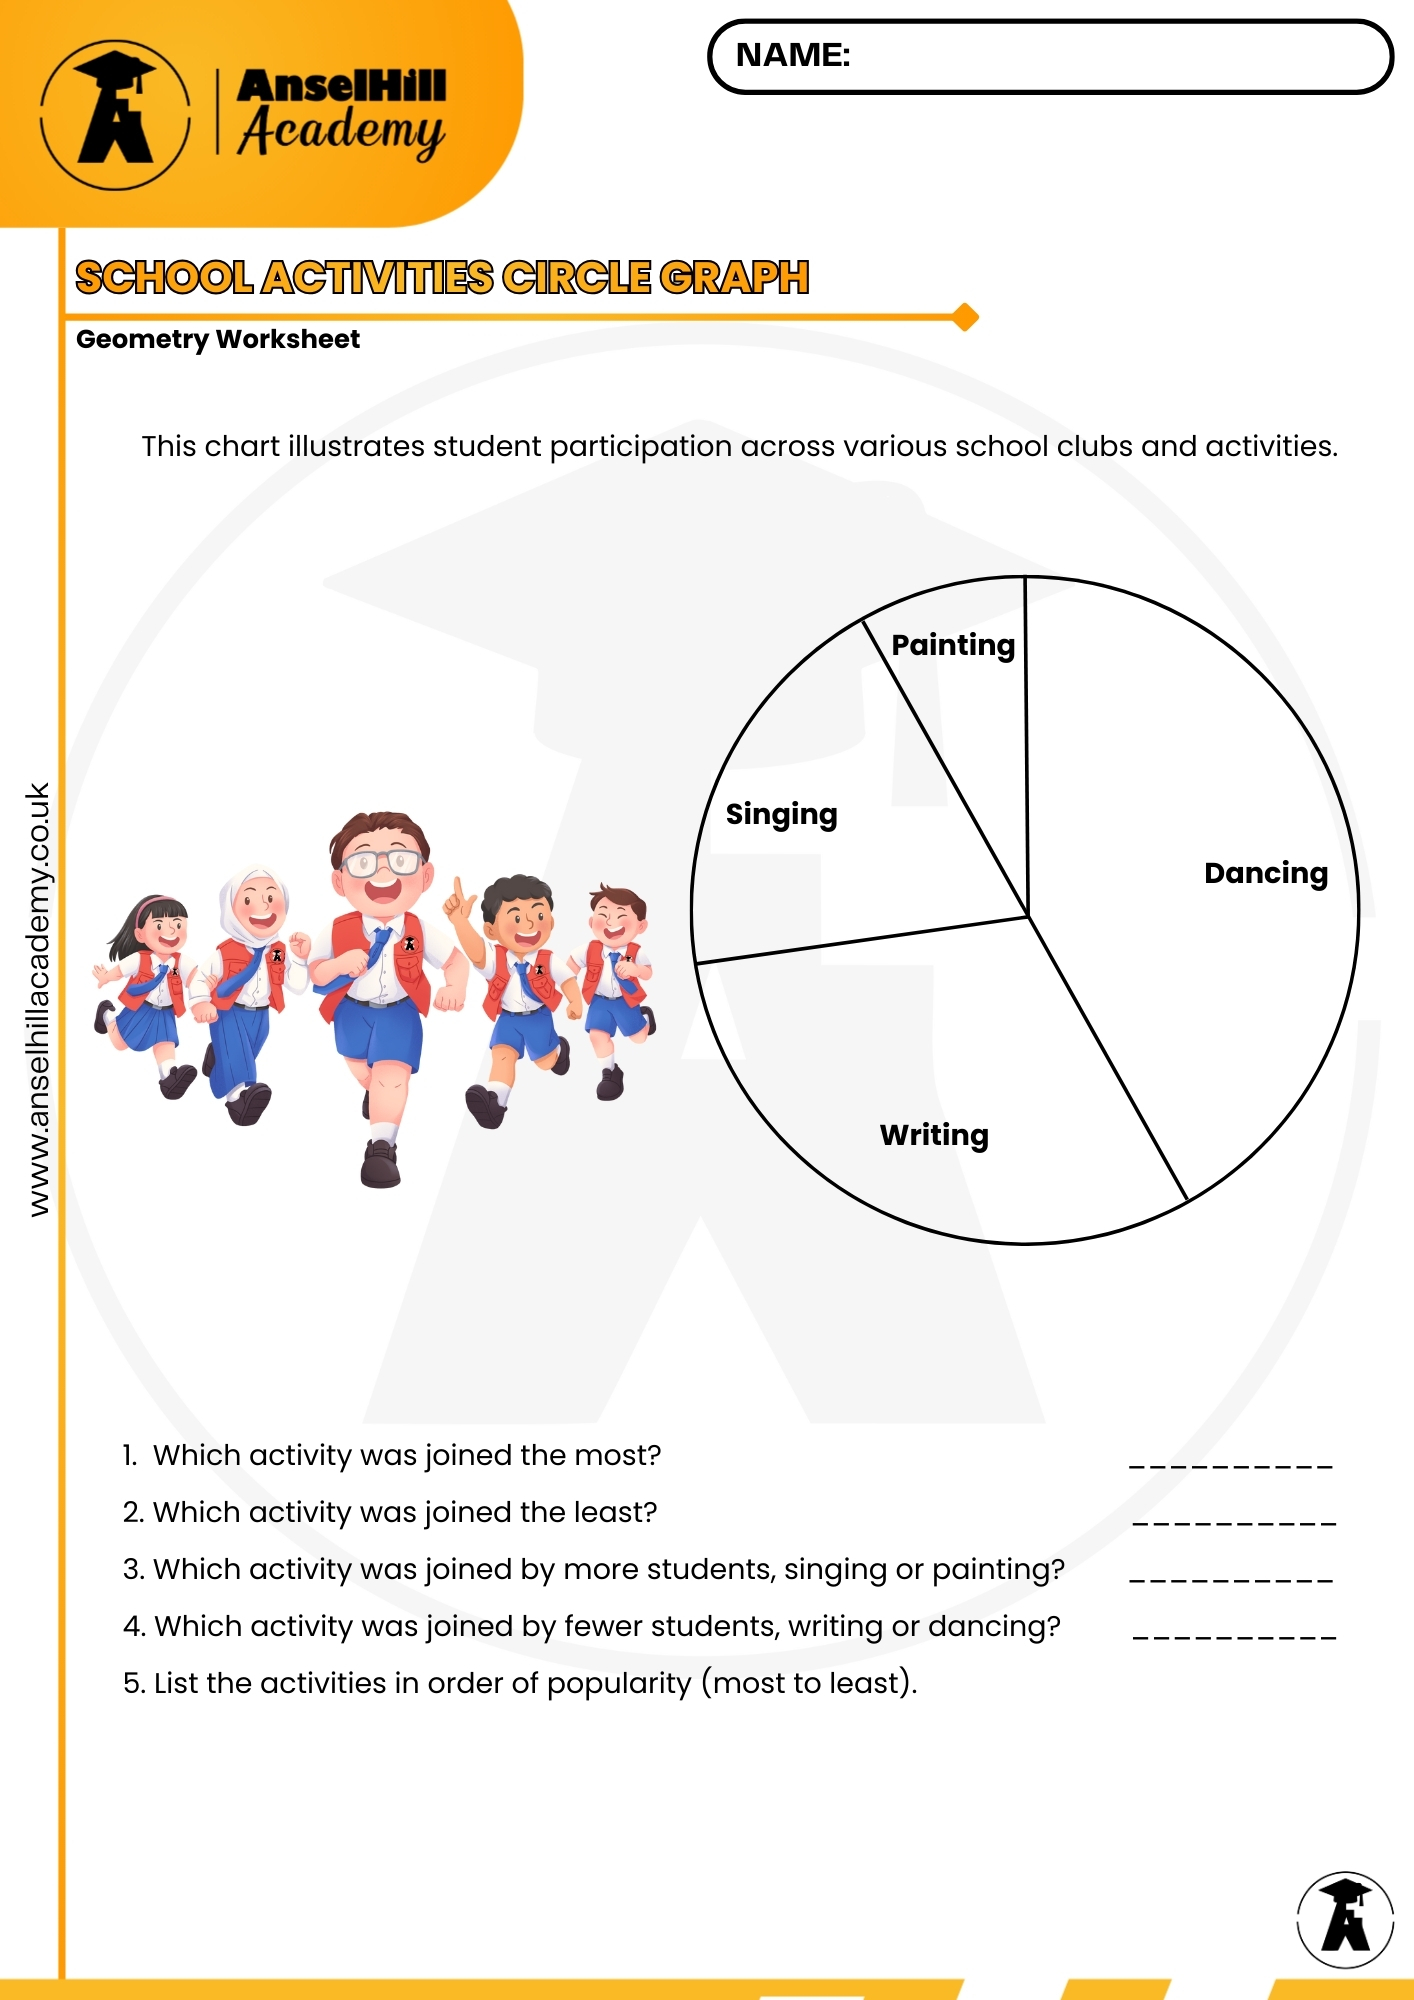
The School Activities Circle Graph – Geometry & Data Handling Worksheet is a carefully designed maths resource that introduces students to interpreting circle graphs using a familiar school-based context.
Learners analyse participation in different school activities—Dancing, Writing, Singing, and Painting—and answer structured questions that build confidence in reading proportions, comparing data, and ranking categories by popularity.
The resource includes:
-
A student worksheet with a clearly labelled circle graph and guided questions
-
A complete answer sheet to support marking, discussion, and independent learning
This worksheet supports both geometry and data handling objectives and is suitable for classroom use, homework, or revision.
🎯 Learning Objectives
Students will be able to:
-
Read and interpret information from a circle graph
-
Identify the most and least popular categories
-
Compare sections of a pie chart accurately
-
Order data based on relative size
-
Develop reasoning skills using visual data
🧠 Skills Developed
-
Data interpretation
-
Geometry awareness (fractions of a whole)
-
Analytical thinking
-
Mathematical reasoning
-
Exam-style questioning


Reviews
There are no reviews yet.